 Editor’s note: This analysis from Steven Duvall, director of research at the Home School Legal Defense Association, appeared recently on the HSLDA website.
Recent growth in homeschooling means that families who teach their kids at home now more closely reflect the nation’s diversity.
Although the description of homeschooling as primarily white and middle class may have been accurate in the distant past,1 more recent evidence suggests that it is largely obsolete because the homeschool population’s racial and income makeup is now much more varied.2 Here’s what some of the recent research indicates.
Racial diversity of homeschooling
When the National Center for Education Statistics (NCES) reported the homeschool population demographics in 1999, 2003, 2007, 2012, and again in 2016, it was evident that, proportionately, white families often outnumbered families who came from other groups by almost two to one.3
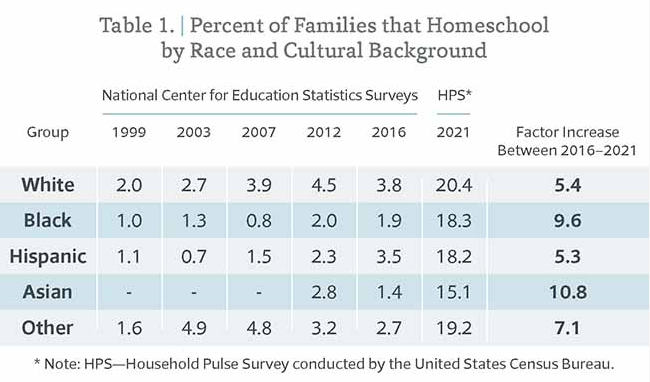
 For example, it can be seen in Table 1 that, compared to Black, Hispanic, Asian, and other families, the proportion of white homeschool families was often twice as large as the other groups. The exceptions were white and Hispanic families being essentially the same in 2016 and the percent of white families being smaller than those of other races in 2003 and 2007.
In contrast to these findings by the NCES, biweekly Household Pulse Surveys (HPS) conducted by the United States Census Bureau (USCB) showed that, by the spring of 2021, all these groups educated their children at home in proportions that were roughly equivalent. 4
For example, as can be seen in the HPS column of Table 1, the percent of white homeschool households in the spring of 2021 was 20.4, but Black, Hispanic, Asian, and Other families were 18.3, 18.2, 15.1, and 19.2, respectively. The percentage of non-white homeschool families in 2021 is impressive: to reach these levels over the last several years, the percent of Black households had to increase by a factor of 9.6, Hispanic households by a factor of 5.3, Asian by 10.8, and Other by 7.1.
What makes these gains even more striking is the fact that they occurred alongside a simultaneous rapid increase in the percent of white homeschool families. Consequently, except in the case of Hispanic households—which were already involved in homeschooling as often as White families in 2016—the increased proportion of each non-white homeschool group has been very substantial.
Homeschooling across income brackets
Homeschool families have often been depicted as being in the middle class because most of them reported average or above-average incomes.5 In the past, this was probably true because the percent of homeschool families who fell in the middle income brackets was generally one-and-one-half to two times larger than the percent of homeschool families who experienced lower or higher incomes.
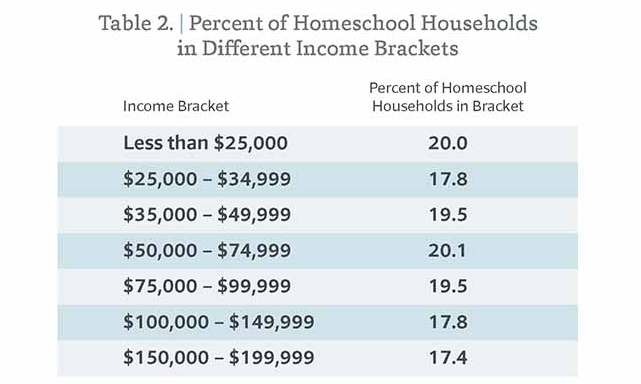
However, according to recent HPS surveys completed during the spring of 2021,6 this is no longer an accurate reflection of the homeschool population because equal proportions of families now come from all income brackets.7
For example, as shown in Table 2, four consecutive surveys by the USCB in the spring of 2021 indicated that an average of about 20 percent of US homeschool households had yearly incomes of less than $25,000, 17.8 percent experienced incomes between $25,000 and $34,999, 19.5 percent between $35,000 to 49,999, and so on.
 Based on older survey patterns, the expectation during the more recent surveys may have been for the middle-income brackets to include one-and-one-half to two times more homeschool families than the upper- and lower-income brackets. However, because the percent of families represented in each income bracket was roughly equivalent in the most recent surveys, it suggests that home education is now common not only in middle-income families but also in families that experience lower and higher incomes, as well.
Conclusions
The homeschool population has much more diversity than ever before. In past decades, for example, white, middle-income families made up the largest percent of homeschoolers. Now, however, equal proportions of other racial and cultural groups have chosen to educate their children at home, as well.
For example, the percent of Asian homeschooling families has grown by a factor of 11, Black families by a factor of 9.6, and Other families by a factor of 7.1. The percent of White and Hispanic families has grown (by a factor of 5.4 and 5.3, respectively) as well.
What these results suggest is that a roughly equivalent proportion of the households across all racial and cultural groups is now involved in homeschooling. In similar fashion, equal proportions of families across every income bracket are choosing to homeschool their children, too.
Consequently, homeschooling is not just popular among a few segments of the U.S. population but is now commonly practiced by families from different racial, cultural, and income backgrounds. In brief, home education has become more diverse than ever and, in doing so, has become a good reflection of the U.S. population in general.
References
1 Rudner, Lawrence M. 1999. “Scholastic Achievement and Demographic Characteristics of Home School Students in 1998.” Education Policy Analysis Archives 7, no. 8. https://files.eric.ed.gov/fulltext/ED424309.pdf
2 United States Census Bureau. 2021. “HPS Week 28 PUF SAS.” https://www.census.gov/programs-surveys/household-pulse-survey/datasets.html; United States Census Bureau. 2021. “HPS Week 29 PUF SAS.” https://www.census.gov/programs-surveys/household-pulse-survey/datasets.html United States Census Bureau. 2021. “HPS Week 30 PUF SAS.” https://www.census.gov/programs-surveys/household-pulse-survey/datasets.html; United States Census Bureau. 2021. “HPS Week 31 PUF SAS.” https://www.census.gov/programs-surveys/household-pulse-survey/datasets.html.
3 Bielick, Stacey, Kathryn Chandler, and Stephen P. Broughman. 2001. Homeschooling in the United States: 1999. Washington, DC: National Center for Education Statistics. https://nces.ed.gov/pubs2001/2001033.pdf; Princiotta, Daniel, Stacey Bielick, and Christopher Chapman. 2006. Homeschooling in the United States: 2003. Washington, DC: National Center for Education Statistics. https://nces.ed.gov/pubs2006/2006042.pdf; National Center for Education Statistics. 2017. “Table 206.10. Number and Percentage of Homeschooled Students Ages 5 through 17 with a Grade Equivalent of Kindergarten through 12th Grade, by Selected Child, Parent, and Household Characteristics: Selected Years, 1999 through 2016.” Washington, DC: National Center for Education Statistics. https://nces.ed.gov/programs/digest/d17/tables/dt17_206.10.asp.
4 United States Census Bureau. 2021. “HPS Week 28 PUF SAS”; United States Census Bureau. 2021. “HPS Week 29 PUF SAS”; United States Census Bureau. 2021. “HPS Week 30 PUF SAS”; United States Census Bureau. 2021. “HPS Week 31 PUF SAS.”
5 Rudner, Lawrence M. 1999. “Scholastic Achievement and Demographic Characteristics of Home School Students in 1998”; National Center for Education Statistics. 2017.
6 National Center for Education Statistics. 2017.
7 United States Census Bureau. 2021. “HPS Week 28 PUF SAS”; United States Census Bureau. 2021. “HPS Week 29 PUF SAS”; United States Census Bureau. 2021. “HPS Week 30 PUF SAS”; United States Census Bureau. 2021. “HPS Week 31 PUF SAS.”


