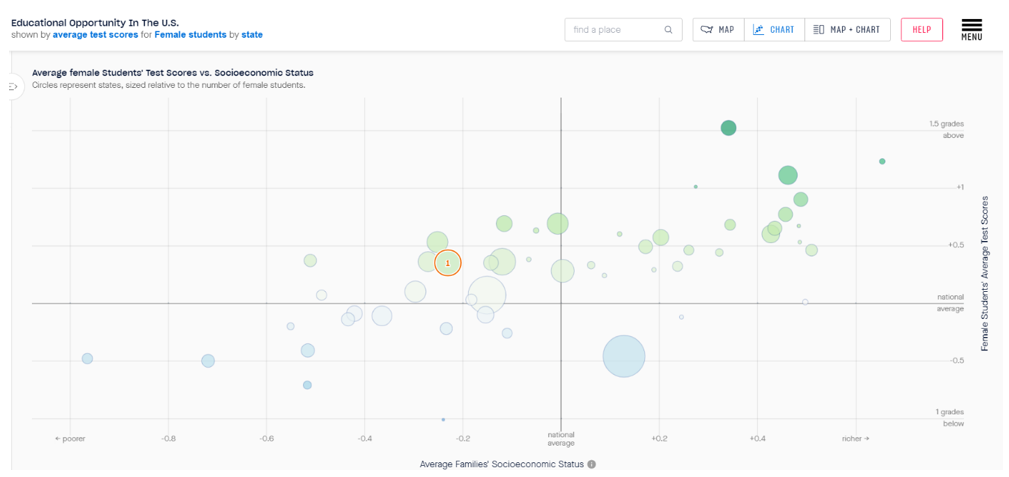
 The Educational Opportunity Project at Stanford University has linked state exams across states for grades 3-8. The chart below shows average test scores by state for female students. Green dots represent states with above-average achievement, blue dots are states with below-average achievement for female students.
Dots are sized by the size of the female student population. Florida is marked 1 to satisfy curiosity, but the key thing to note here is the ratio of green to blue dots. Other than that big blue California dot, the chart for females is pretty green.
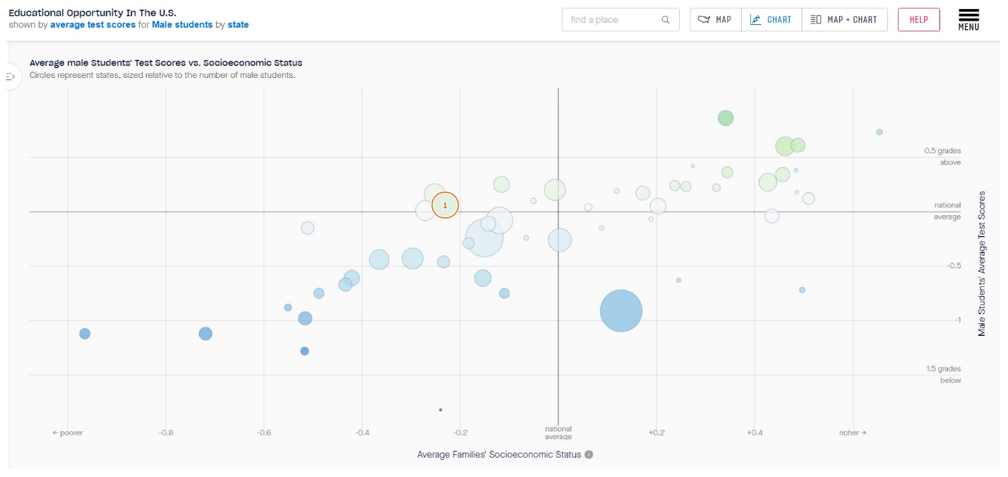
 Now look at the same chart for male students by state:

Not only has blue (below-average achievement) taken over in the male student chart, every state without exception shows lower achievement for boys than girls.
If you flip a coin 50 times and get the same result every time, something systematic is almost certainly in play. While poor and non-poor students often attend different sets of schools, boy and girls usually attend the same schools. An examination of the male-female achievement gap in Florida public schools found the biggest gaps associated with the lowest-performing schools.
The least effective schools in the Florida study weren’t great at educating females, but they are especially woeful at educating males.
Boys lead in all the problematic categories, such as expulsions and dropouts, and trail in all the important areas such as achievement, academic growth, graduation, college attendance and college graduation. Moreover, many of these trends have been evident in the data for decades.
One part of reimagining public education moving forward should be new education options for boys.


